Data Visualizations
Interactive Data Tools
Public-facing tools to explore growth trajectories, counterfactual paths, and threat timelines.
Anatomy of a Lost Decade
Compare actual total GDP against IMF WEO vintage forecasts for resource-discovering countries. Hover for values; toggle series.
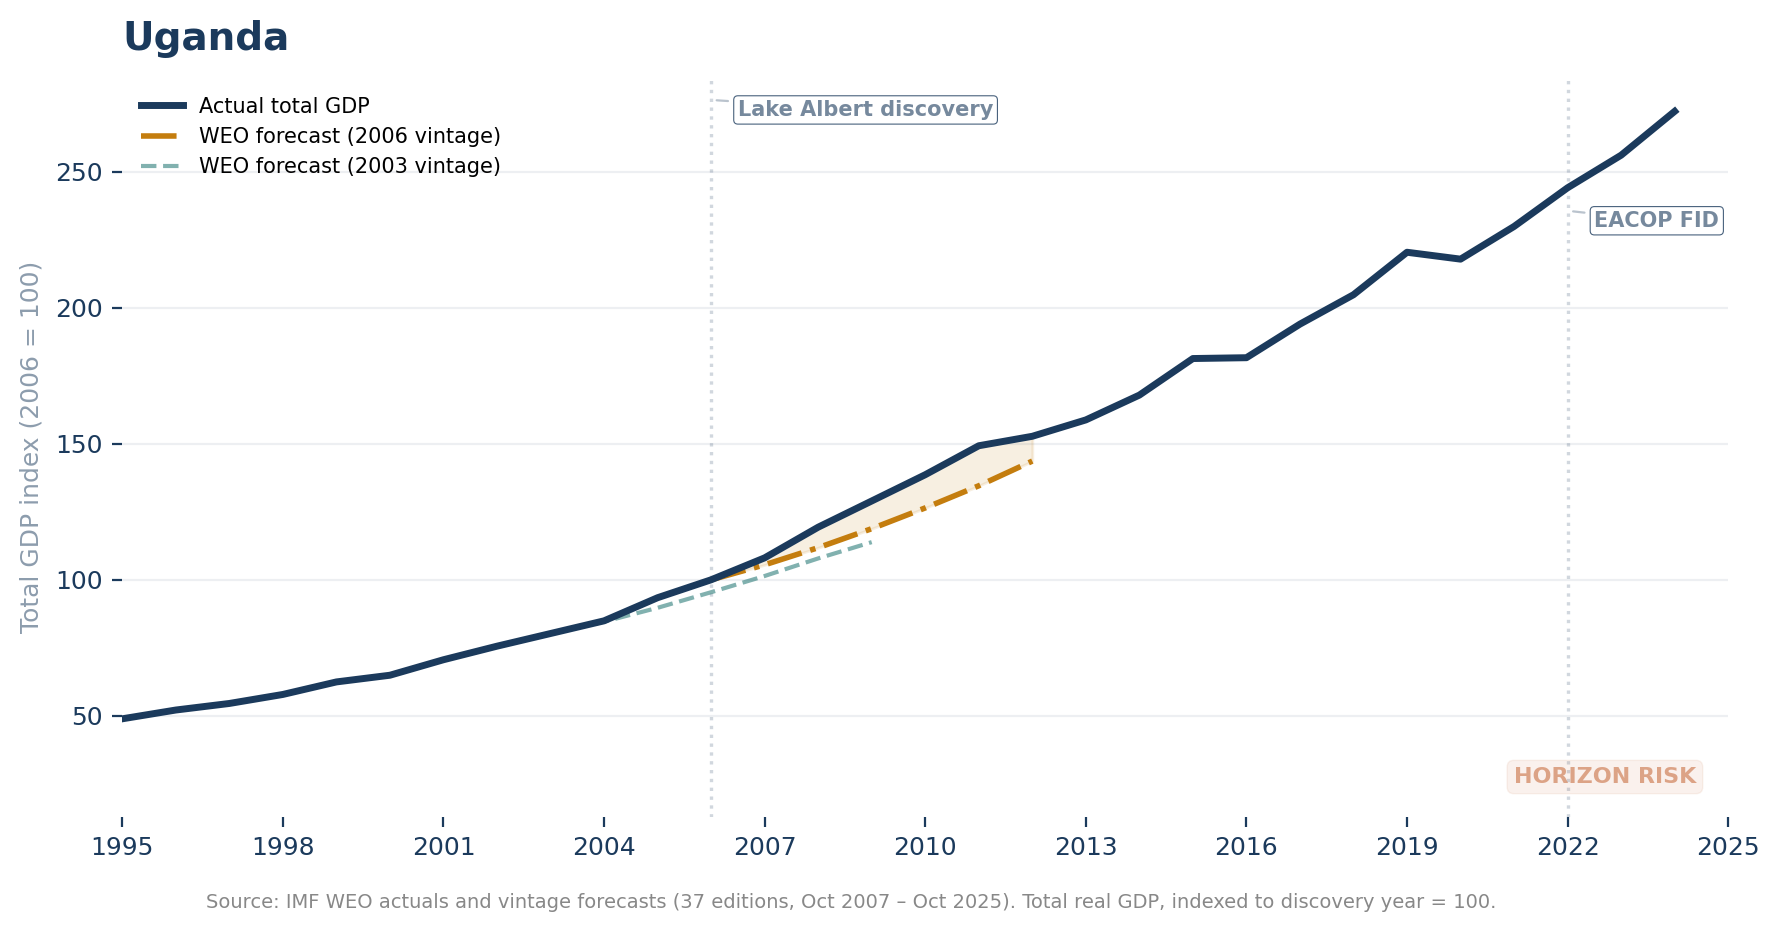
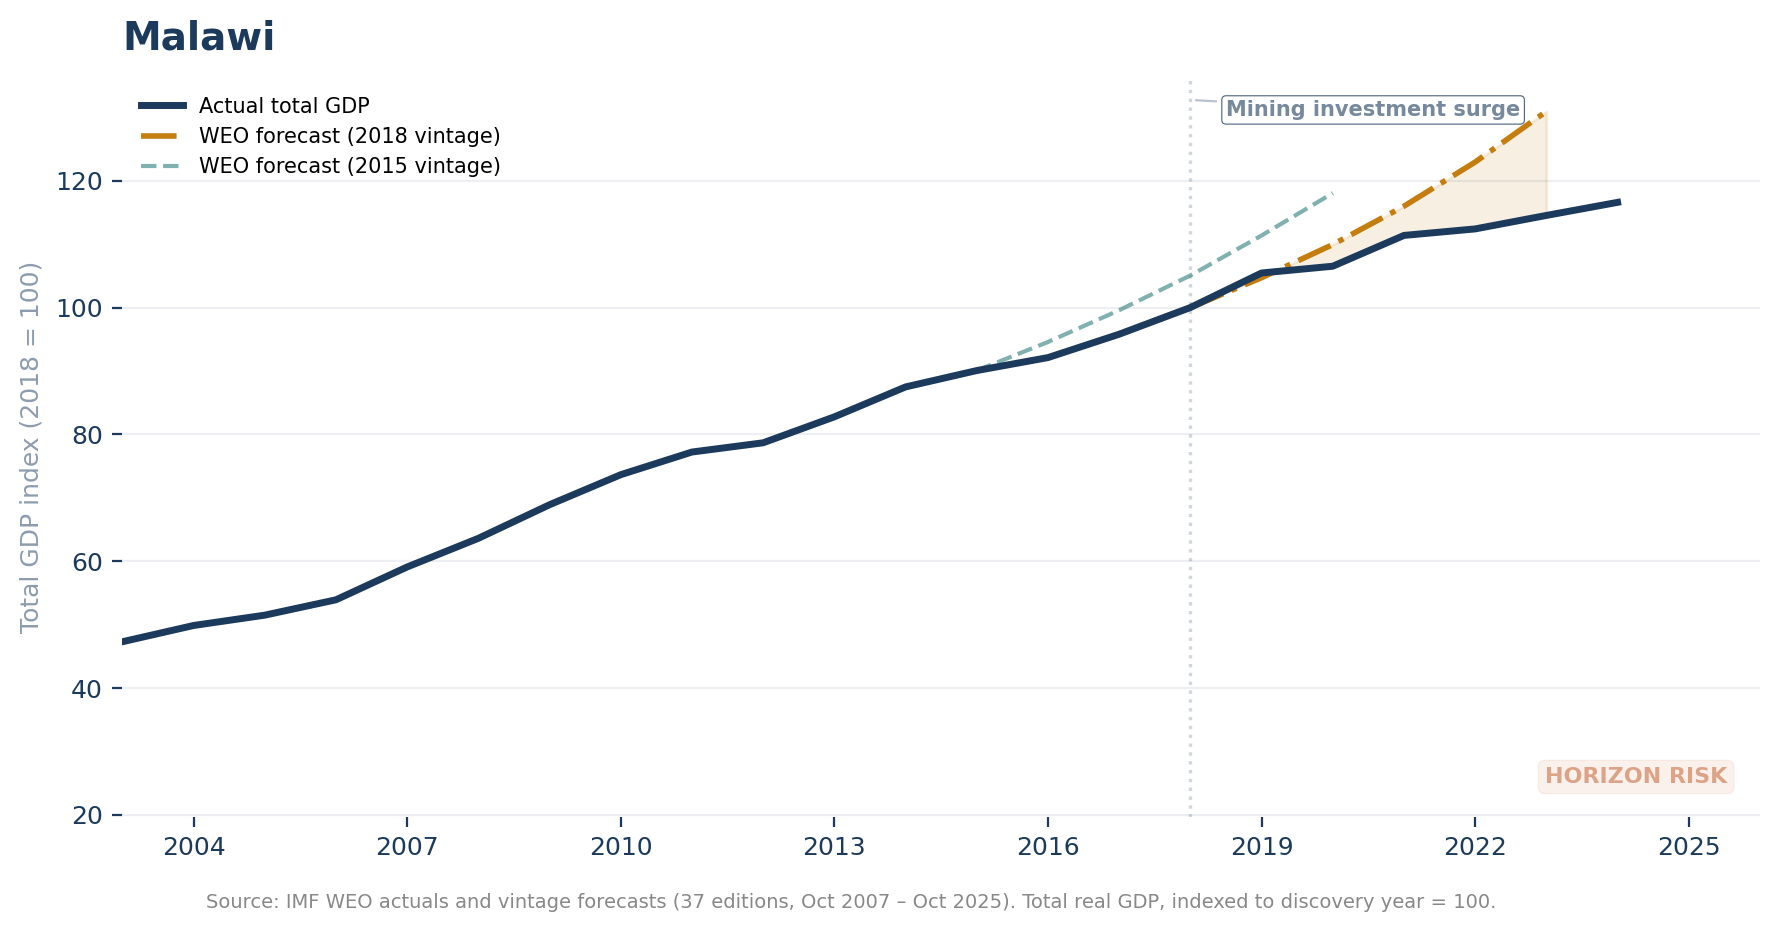
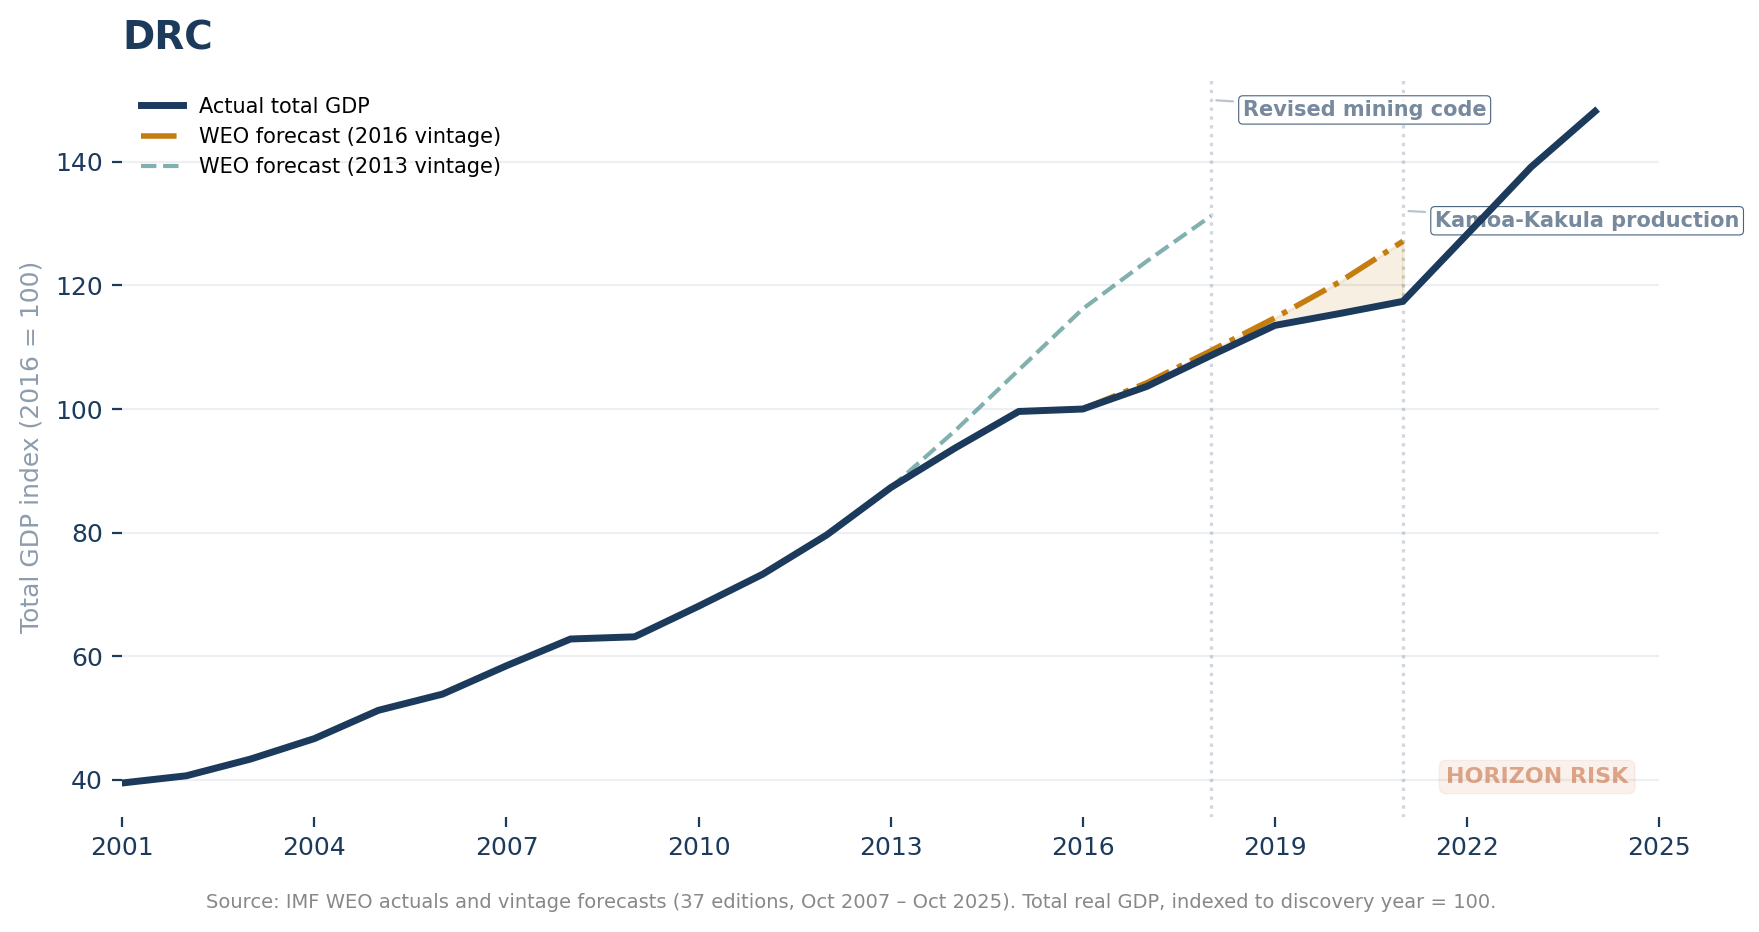
Anatomy of a Lost Decade
Total GDP trajectories for resource-discovering countries — actual outcomes vs. IMF forecasts at time of discovery. Index: discovery year = 100.
Source: IMF World Economic Outlook vintage forecasts (actual growth and 1-year-ahead forecast chains). Amber shading: forecast exceeds actual (over-forecast). Navy shading: actual exceeds forecast. Both series indexed to discovery year = 100. 9 countries covering SSA hydrocarbon and copper discoveries, and Guyana.
Data note: Total real GDP indexed to discovery year = 100 using IMF WEO actual growth rates (same source as forecasts). WEO forecast chains use IMF vintage 1-year-ahead forecasts cumulated from discovery year. Both series share a common unit and source, eliminating cross-source measurement inconsistencies. 9 countries covering SSA hydrocarbon and copper discoveries, and Guyana. All data and replication code will be open-sourced.
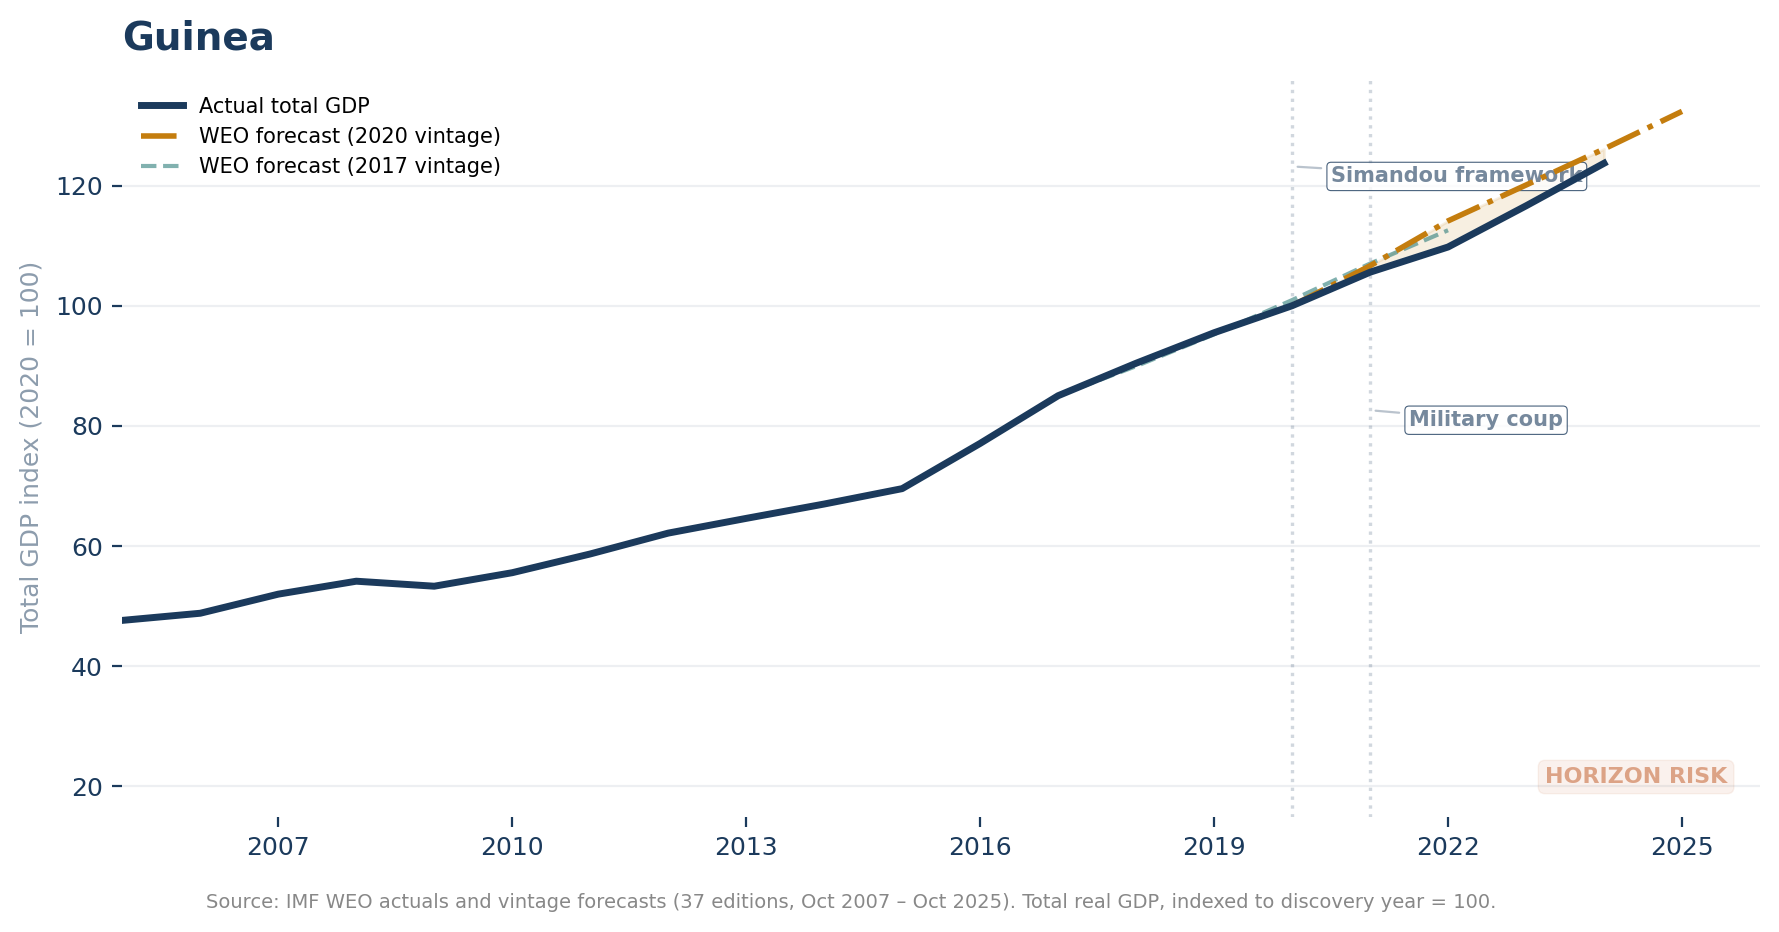
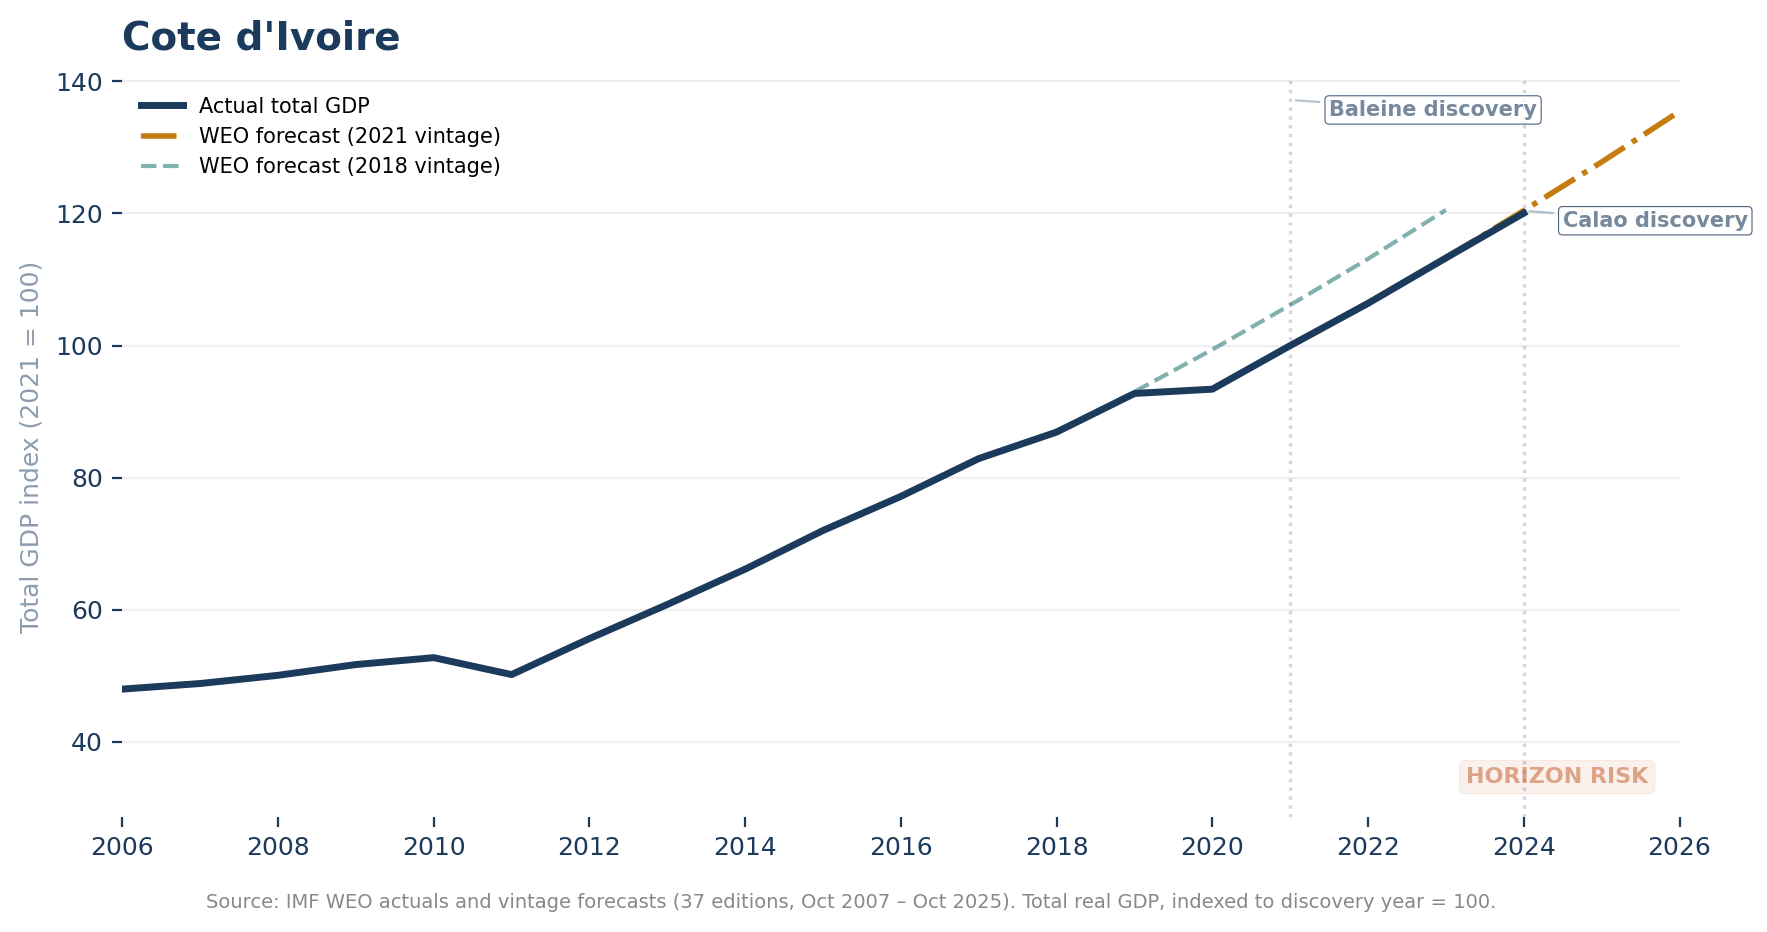
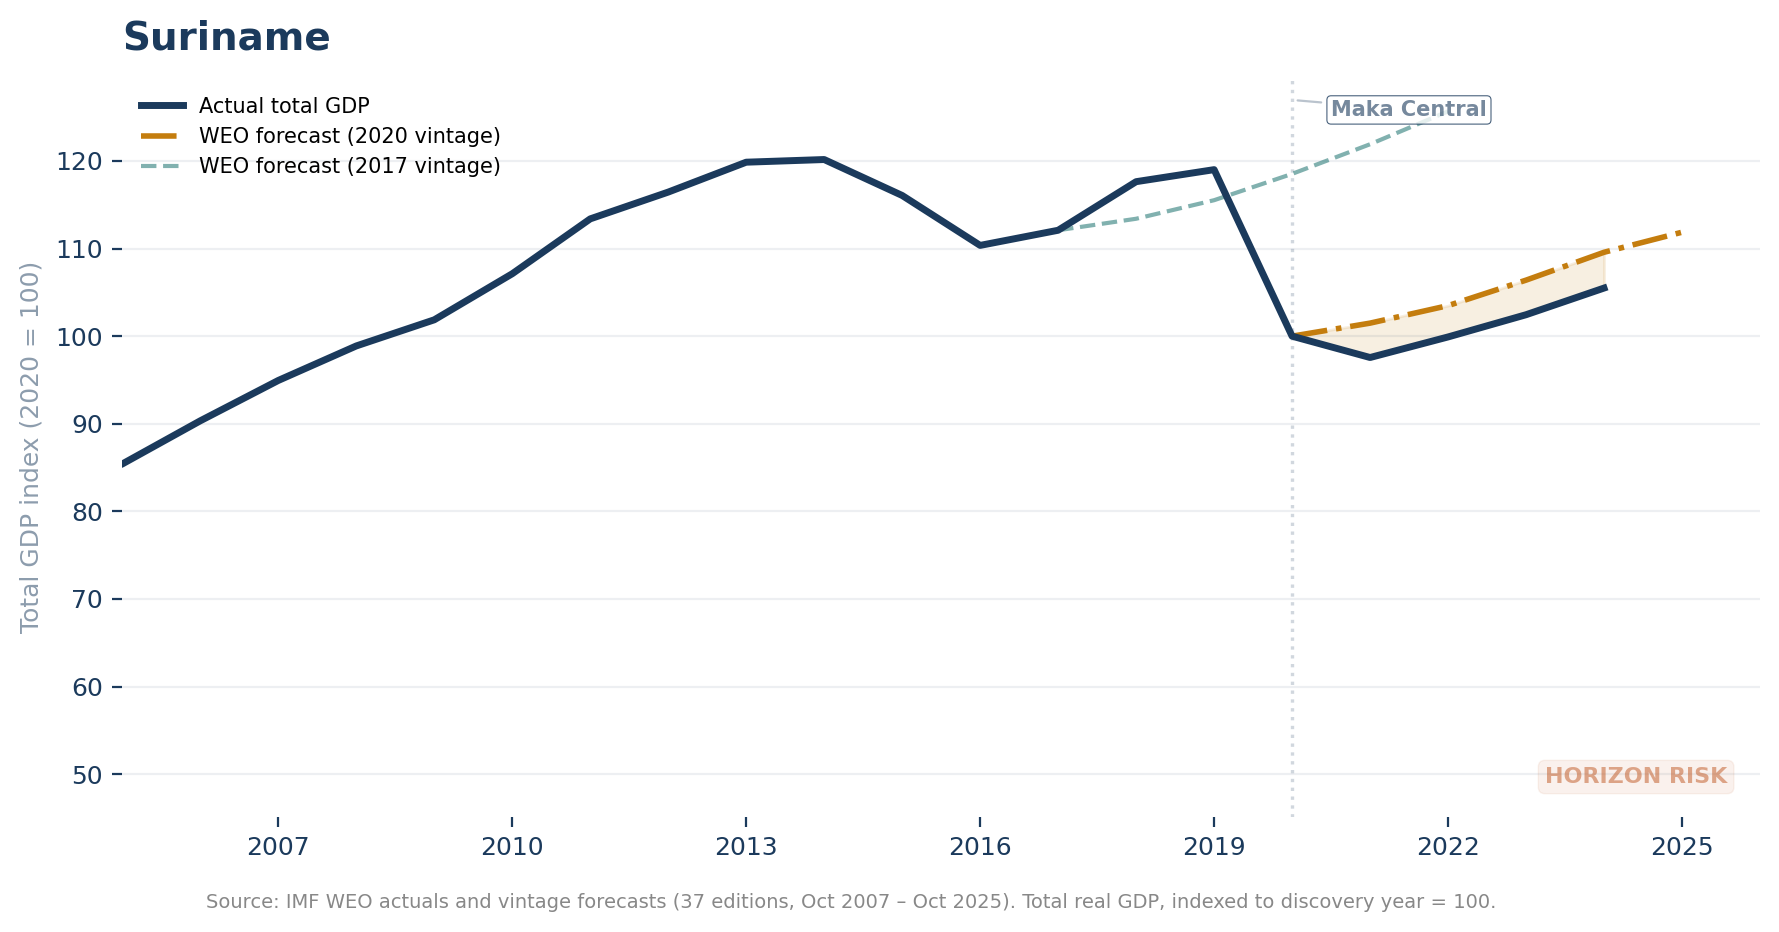
Horizon Risk: Growth Trajectories
Total real GDP trajectories for twelve countries at risk of the presource curse, measured against IMF WEO vintage forecasts from the discovery year. The amber shaded region shows the expectations gap.
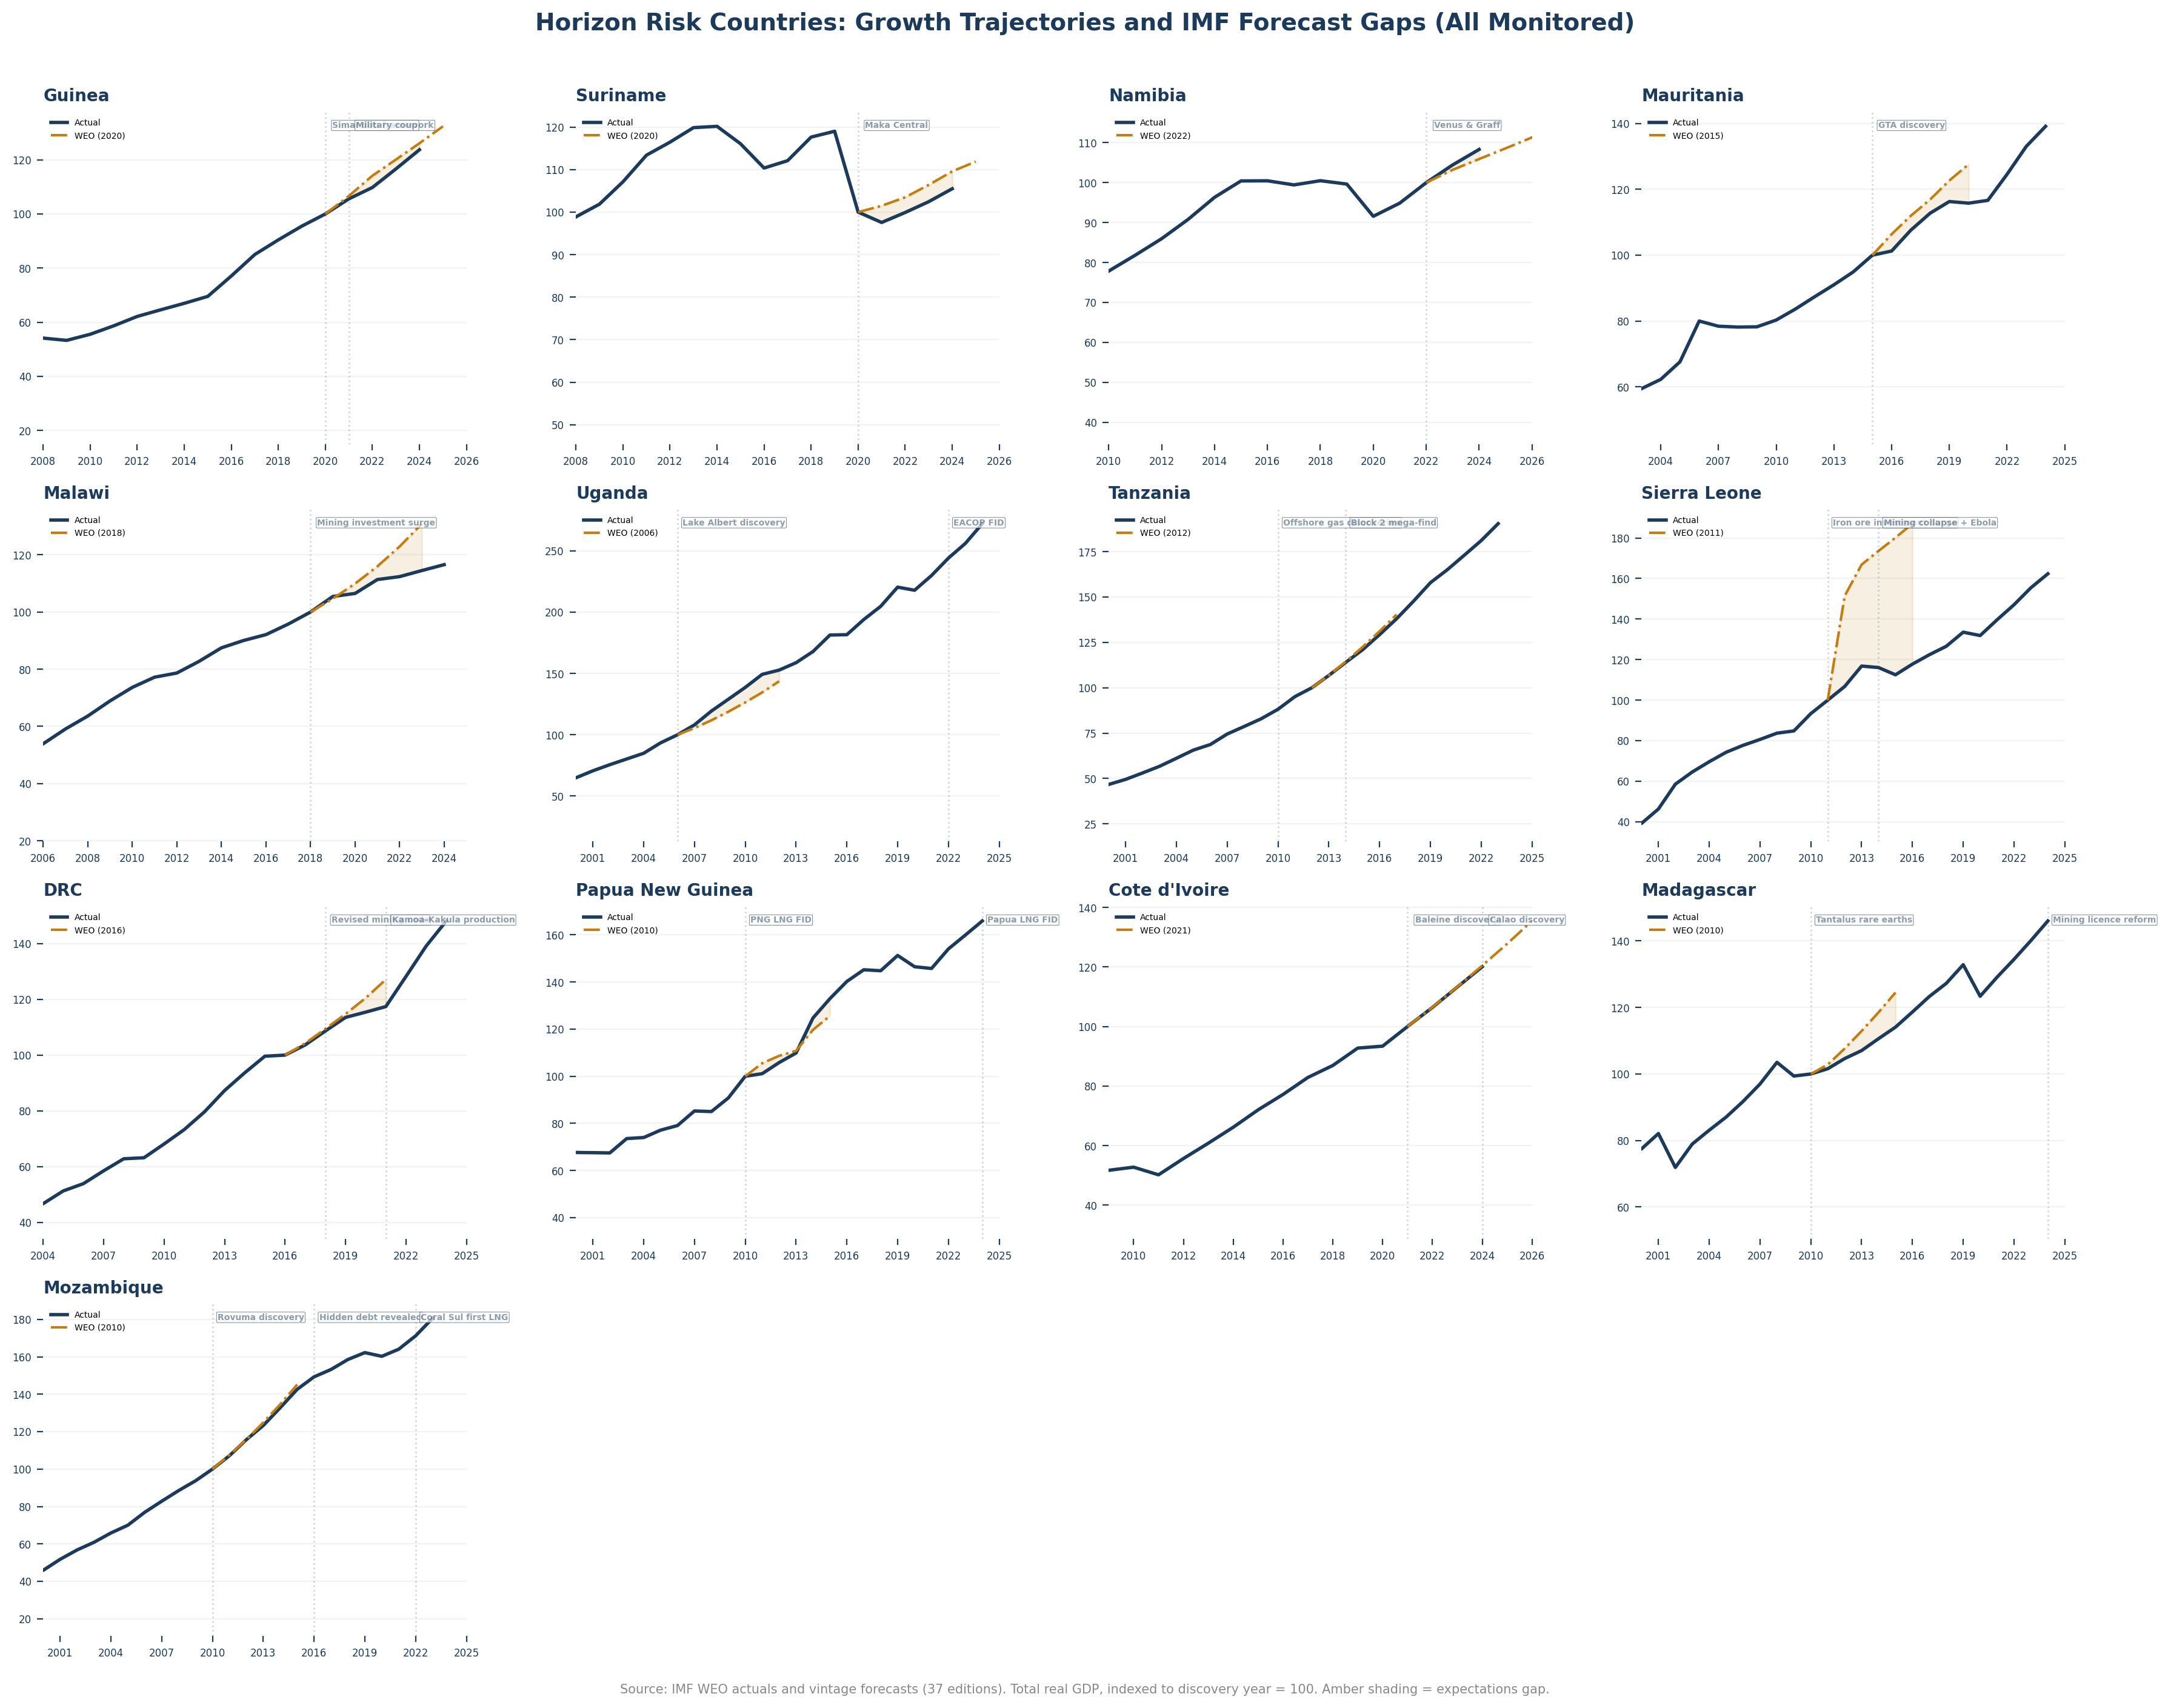
Data note: Total real GDP indexed to discovery year = 100 using IMF WEO actuals. Amber dashed line shows IMF WEO vintage forecast from discovery year (5-year ahead). Both actuals and forecasts come from a single WEO source, eliminating cross-source measurement noise.
Borrowing Against Expectations
How does public debt respond to giant petroleum discoveries? This chart tracks central government debt as a share of GDP, aligned to discovery year. The pattern is clear: most discoverers accumulate significant debt in the years immediately following discovery — before any revenue arrives.
Borrowing Against Expectations
How public debt levels respond to giant petroleum discoveries. Central government debt as % of GDP, aligned to discovery year.
Source: IMF Global Debt Database 2.0 (1950–2024). Central government debt except Tanzania (general government). Amber shading indicates the first 5 years post-discovery. * = HIPC debt relief overlaps discovery window (shown dashed). Bold grey line = non-HIPC average.
Data note: Central government debt (% GDP) from the IMF Global Debt Database 2.0. Tanzania uses general government series where central government data is unavailable. Countries marked with * received HIPC debt relief during the discovery window, confounding the borrowing response. The non-HIPC average (bold grey line) provides the aggregate pattern. Discovery dates from the Cust–Mihalyi–Rivera-Ballesteros giant discovery database.
In the Pipeline
Counterfactual Growth Explorer
User-selected country and scenario — modelled growth paths.
Presource Curse Timeline
Discovery to production — fiscal and governance indicators.
Growth Threat Dashboard
Country-level risk indicators, updated annually.