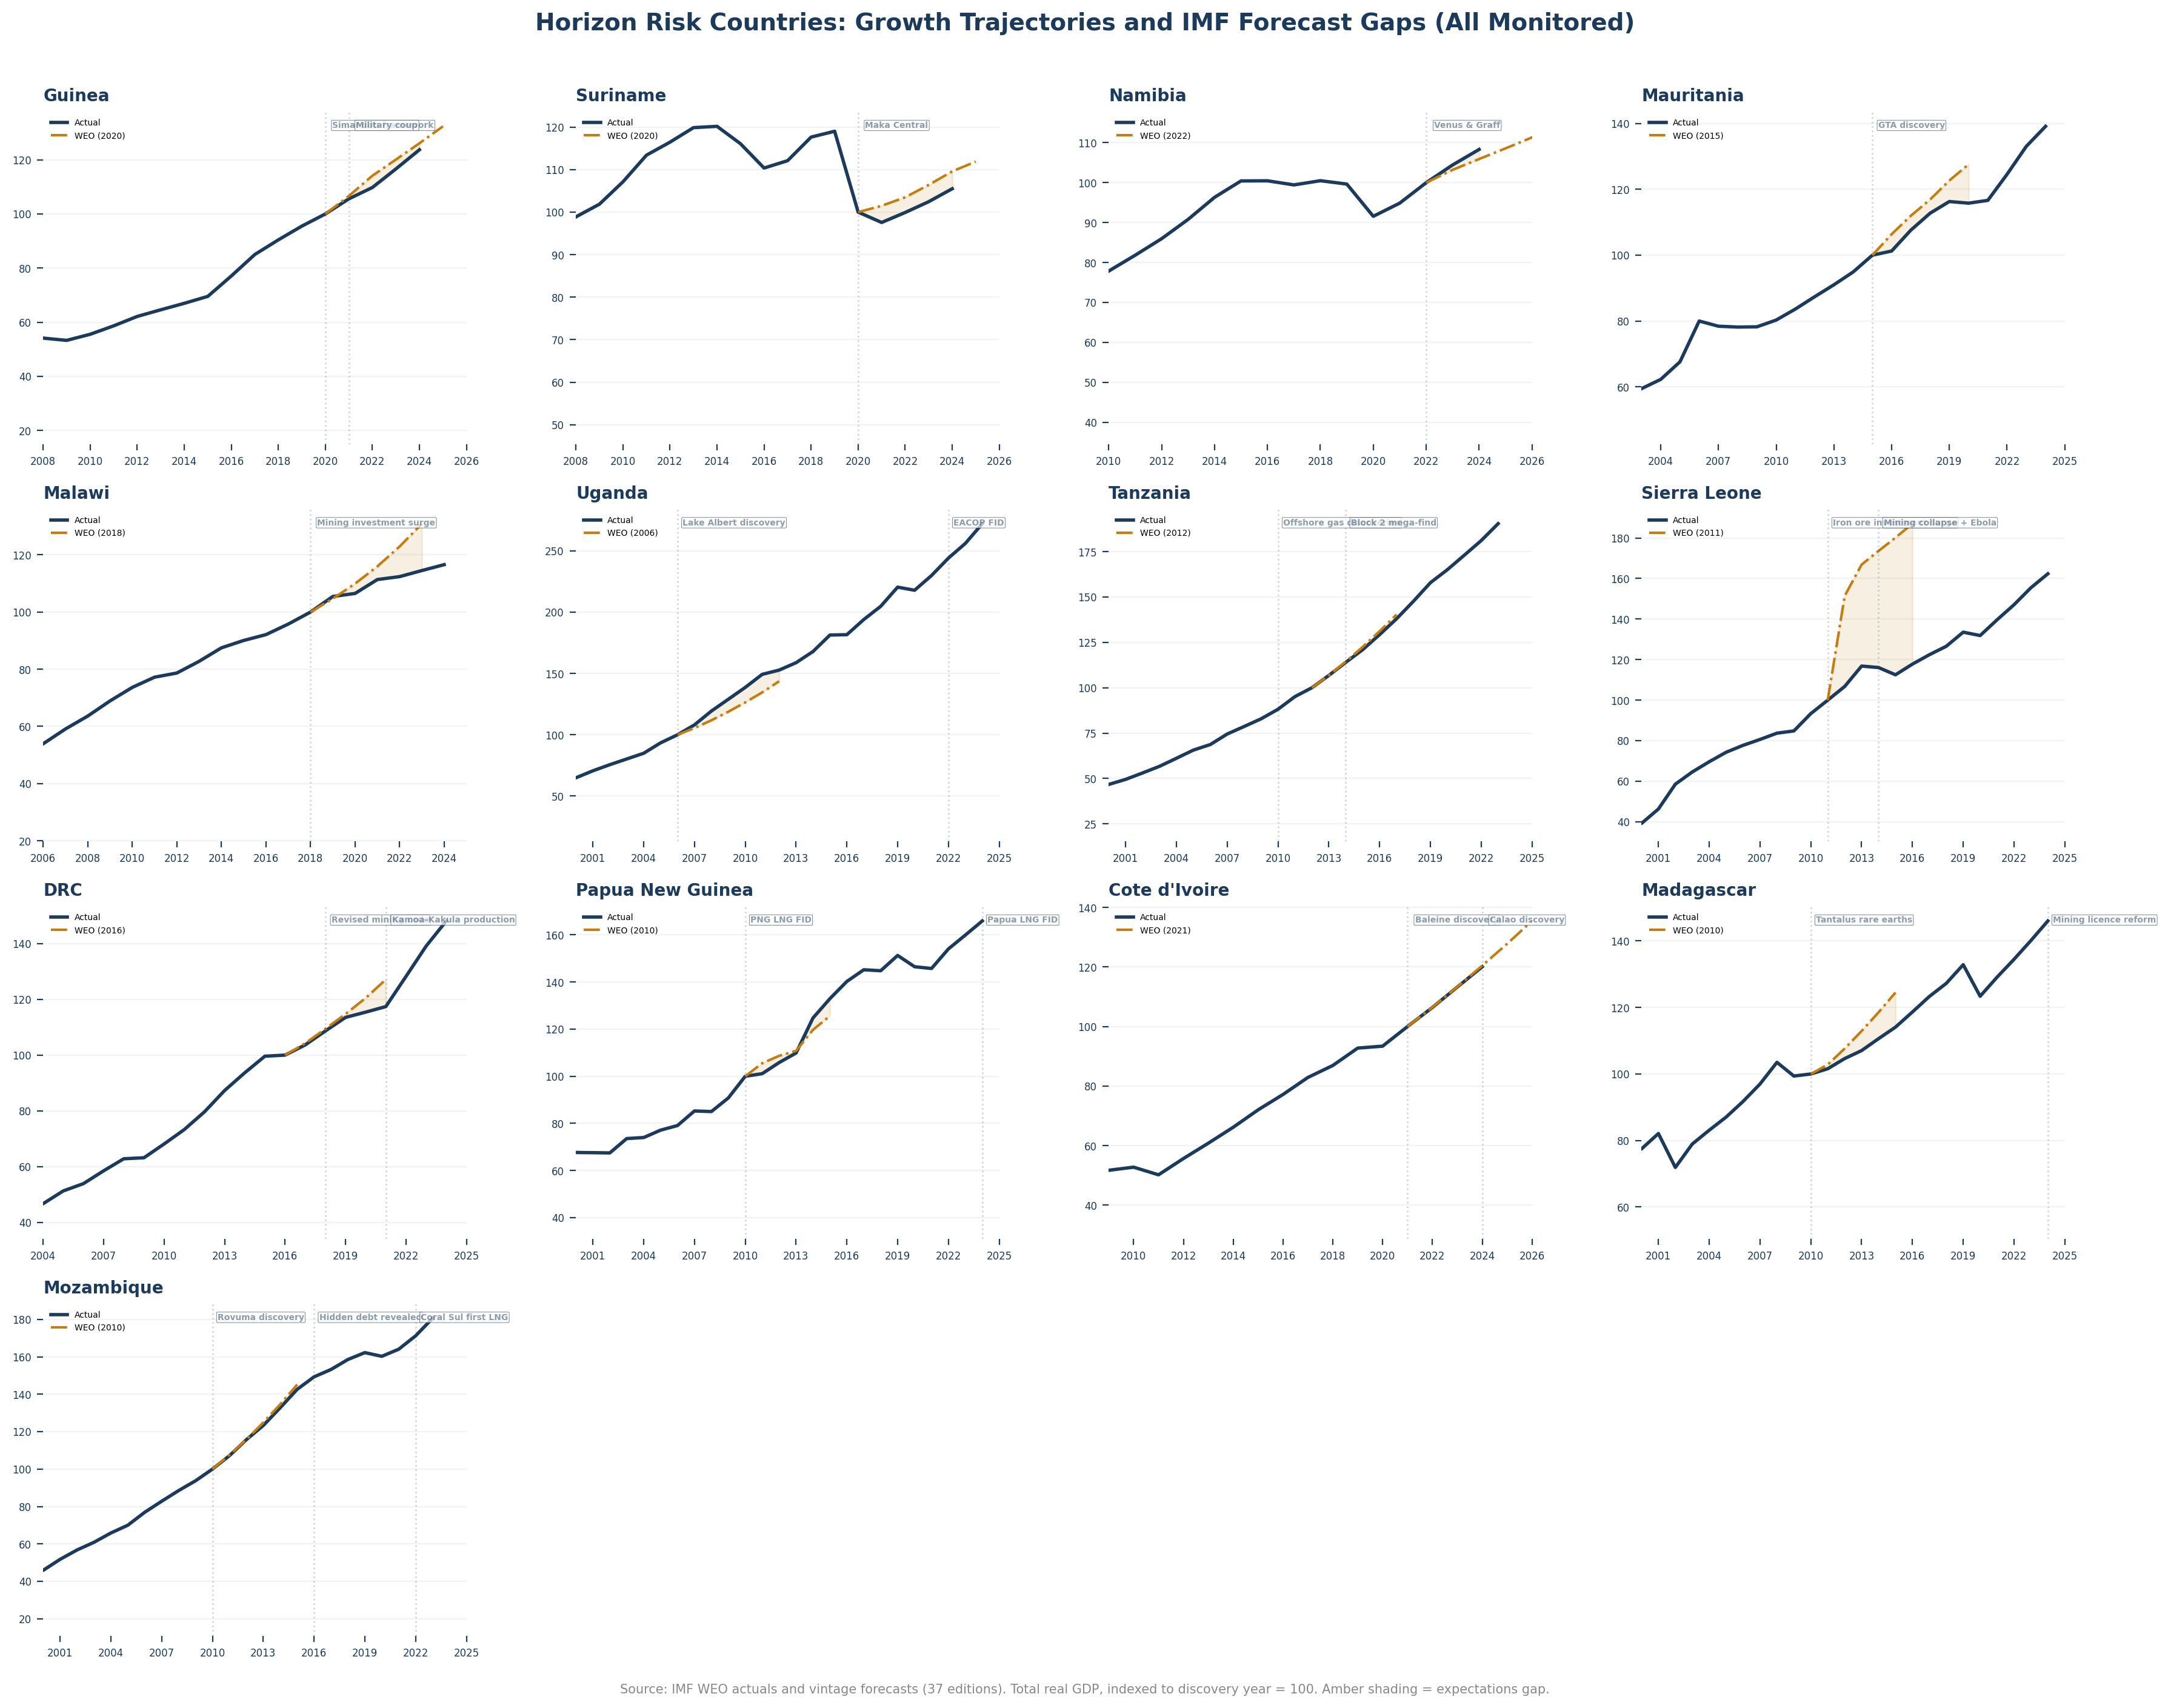
Horizon Risk Explorer
Total real GDP trajectories for twelve countries at risk of the presource curse, measured against IMF WEO vintage forecasts from the discovery year.
Full Watchlist Overview
Country Explorer
Horizon Risk Explorer
Total real GDP trajectories vs. IMF WEO vintage forecasts for countries at risk of the presource curse. Both series use a single WEO source. Select a country or view grouped overviews.
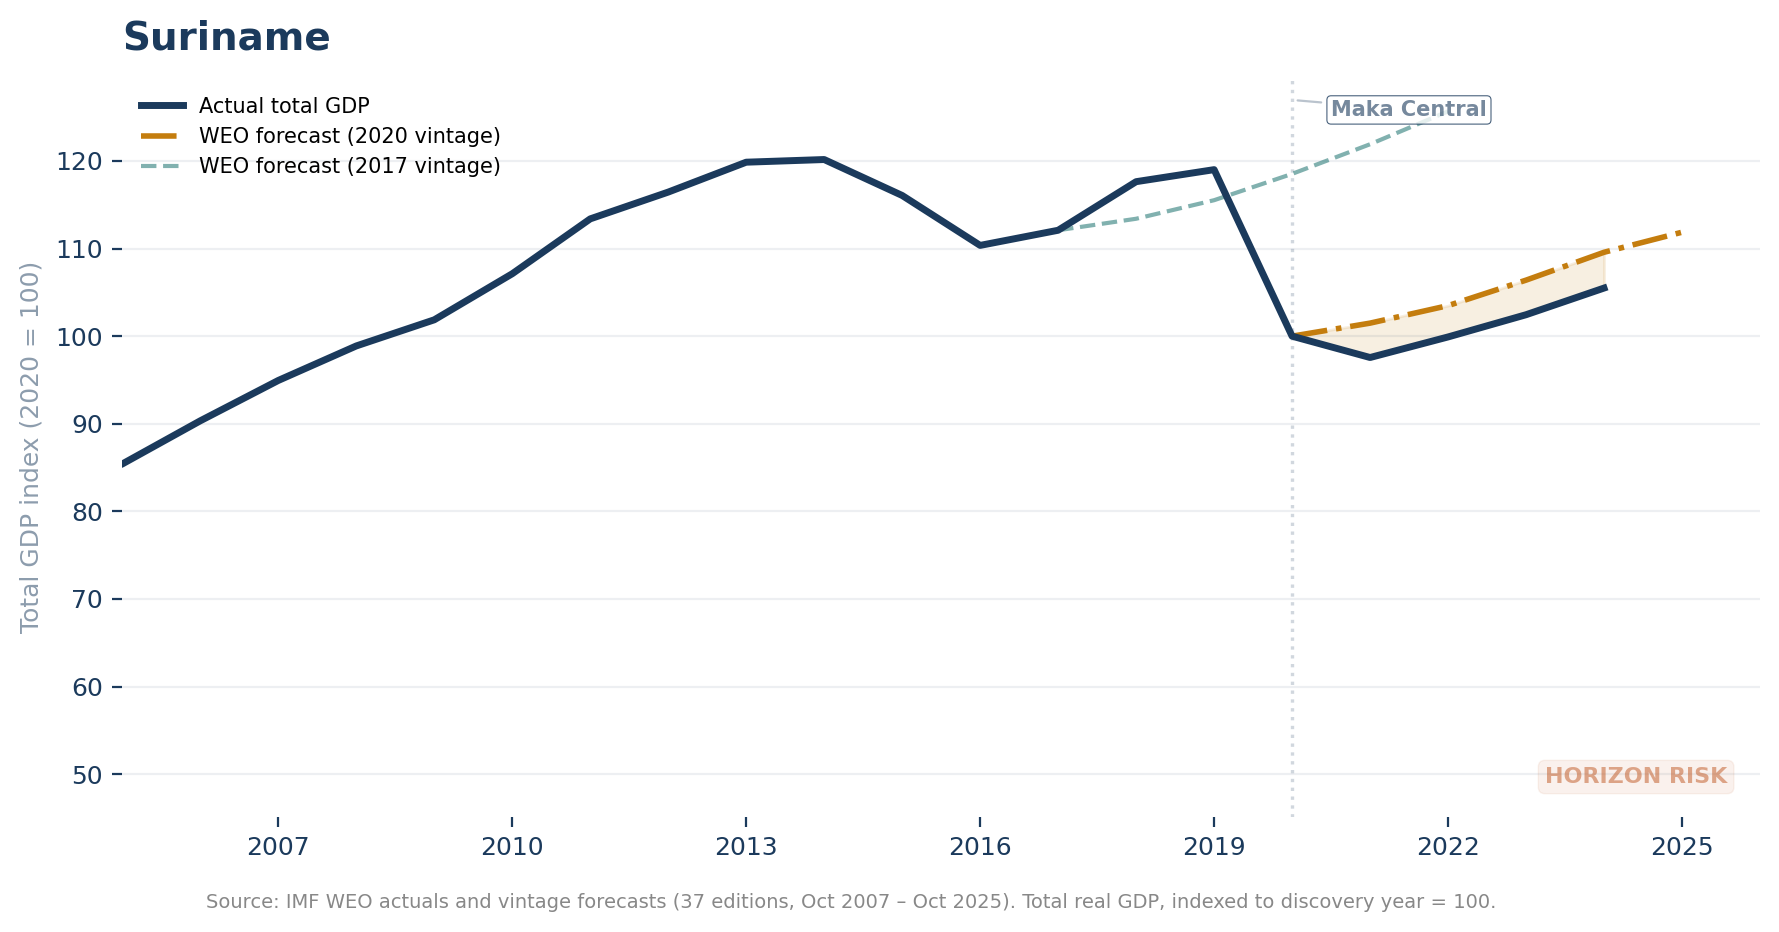
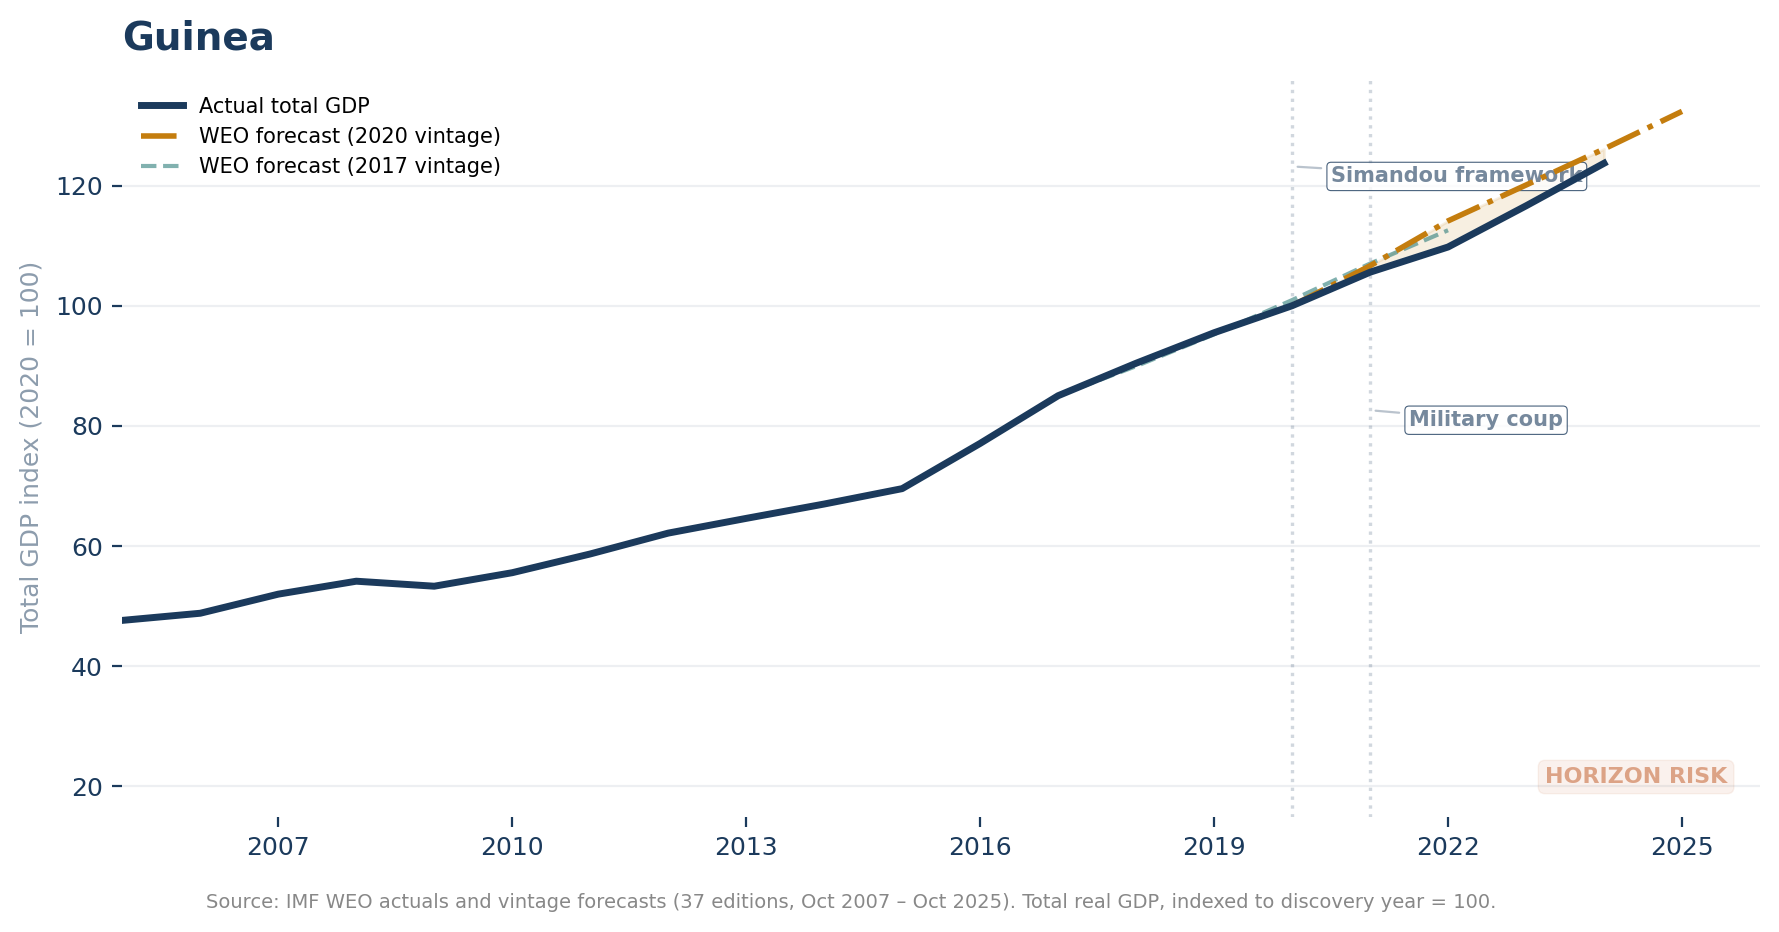
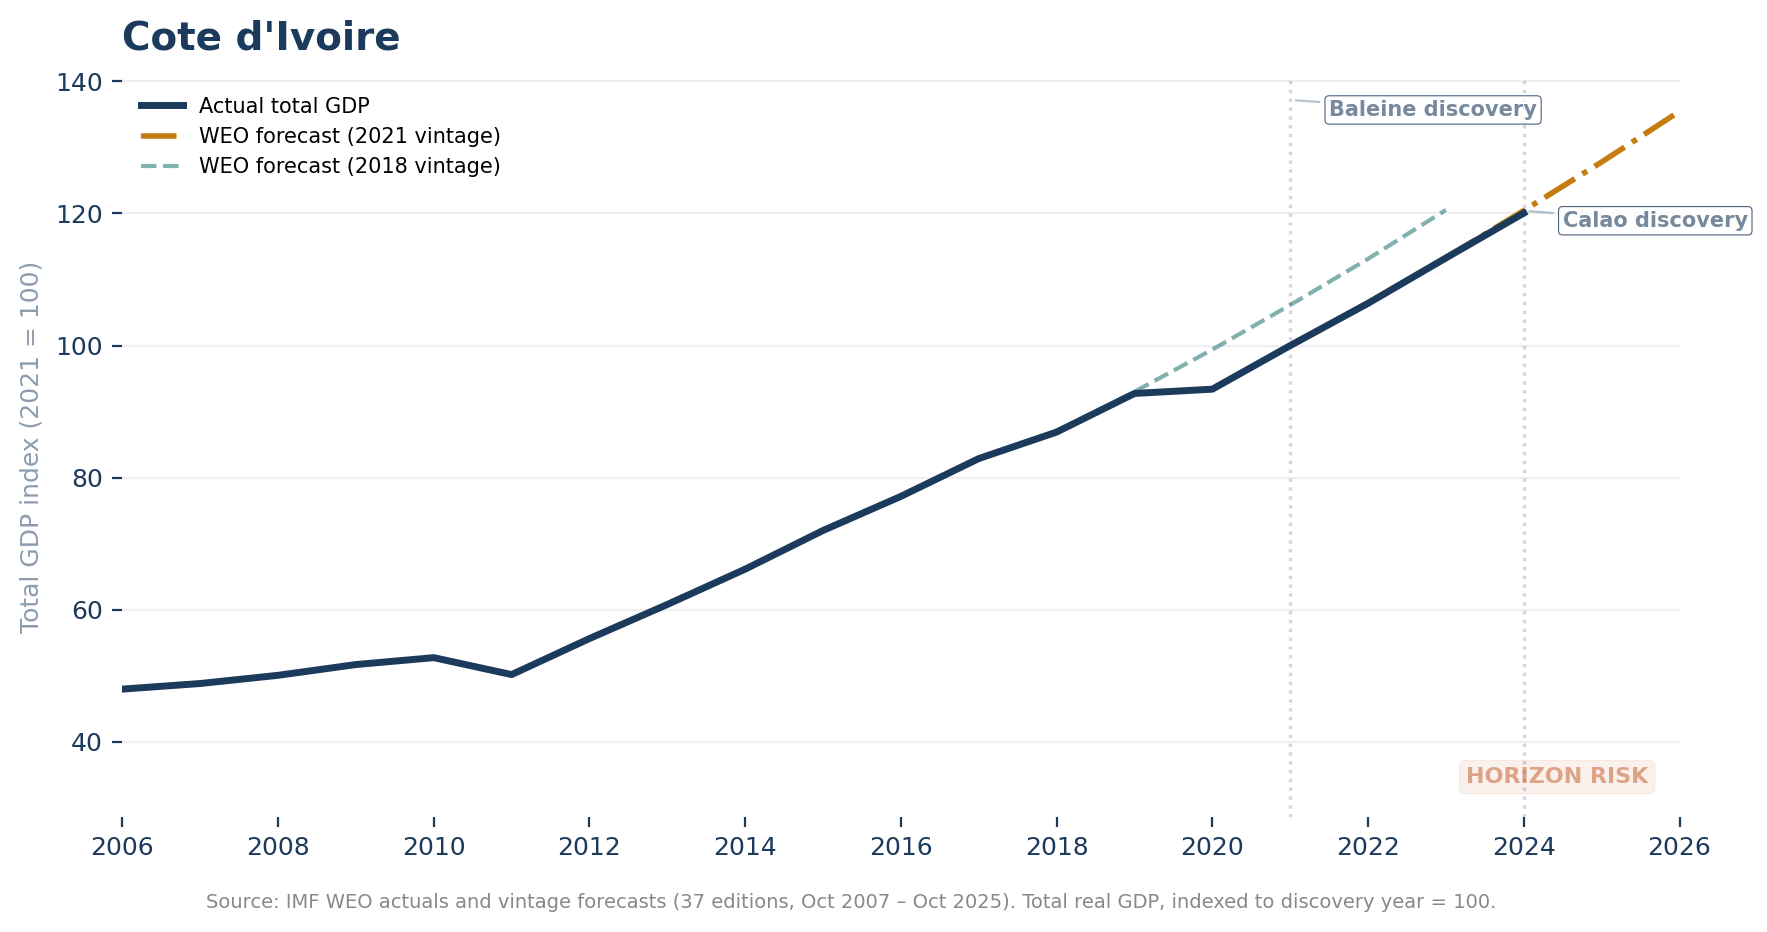
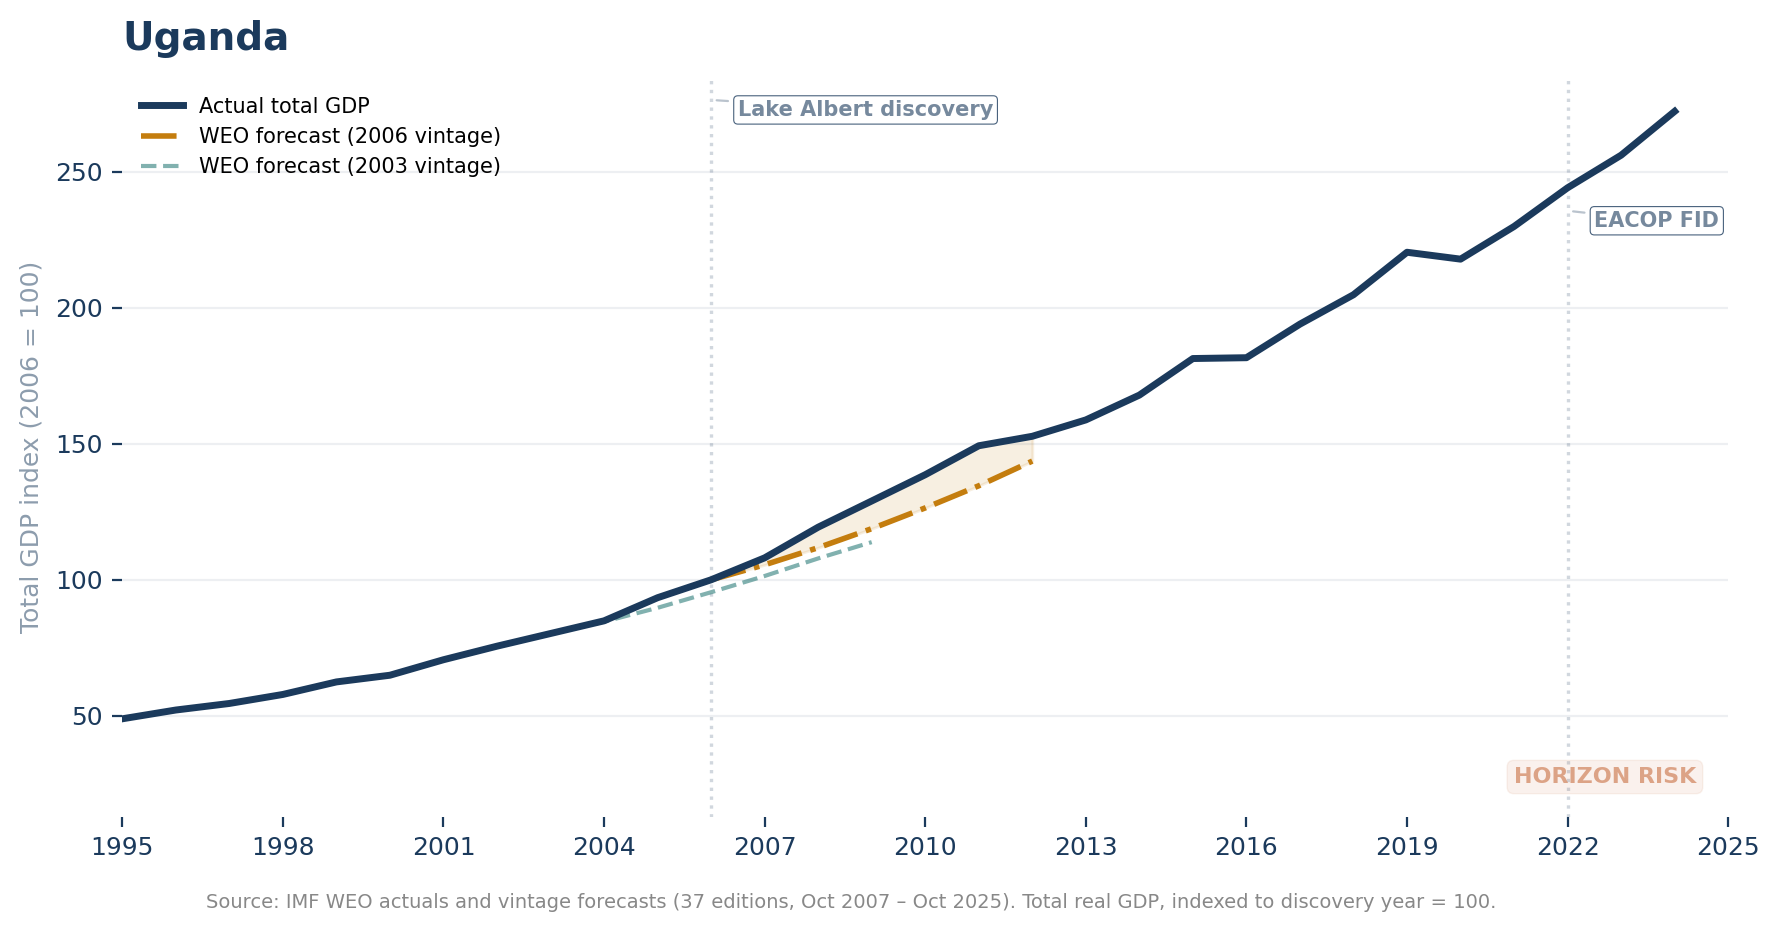
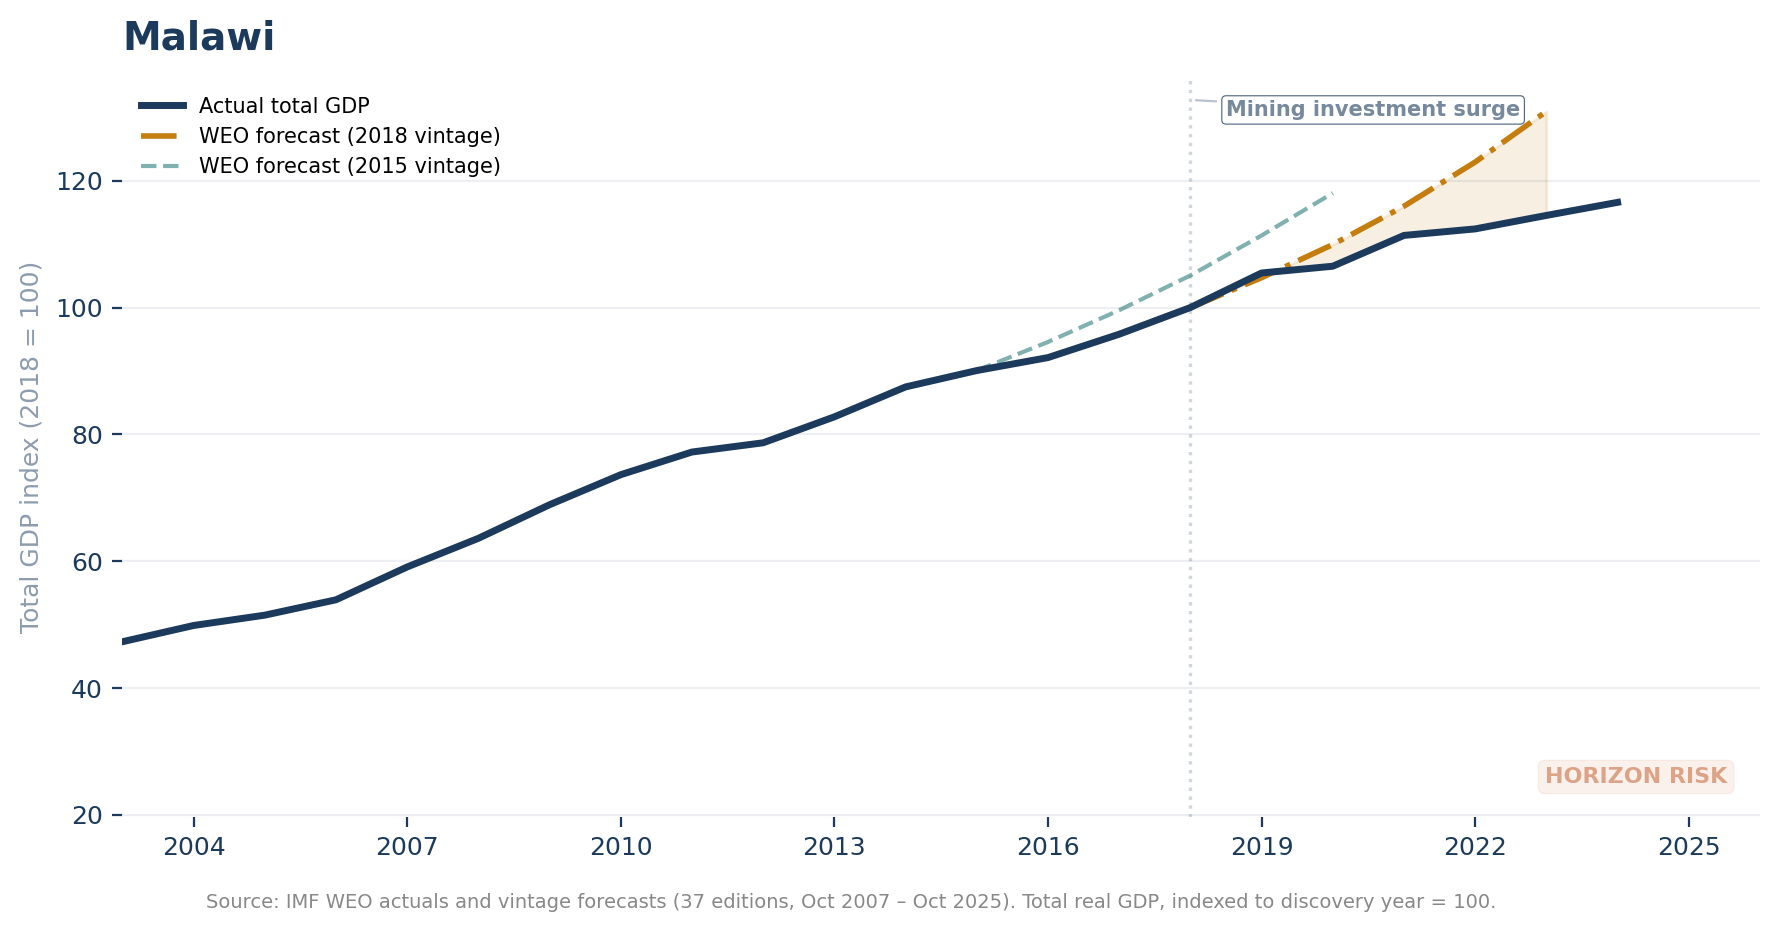
Source: IMF World Economic Outlook actuals and vintage forecasts (37 editions, Oct 2007 – Oct 2025). Navy line = actual total real GDP (indexed to discovery year = 100). Amber dashed = WEO forecast from discovery year. Shaded region = expectations gap. Both series use a single WEO source to eliminate cross-source measurement noise.
Featured Countries
Guinea
Cote d'Ivoire
Suriname
Uganda
Malawi
DRC
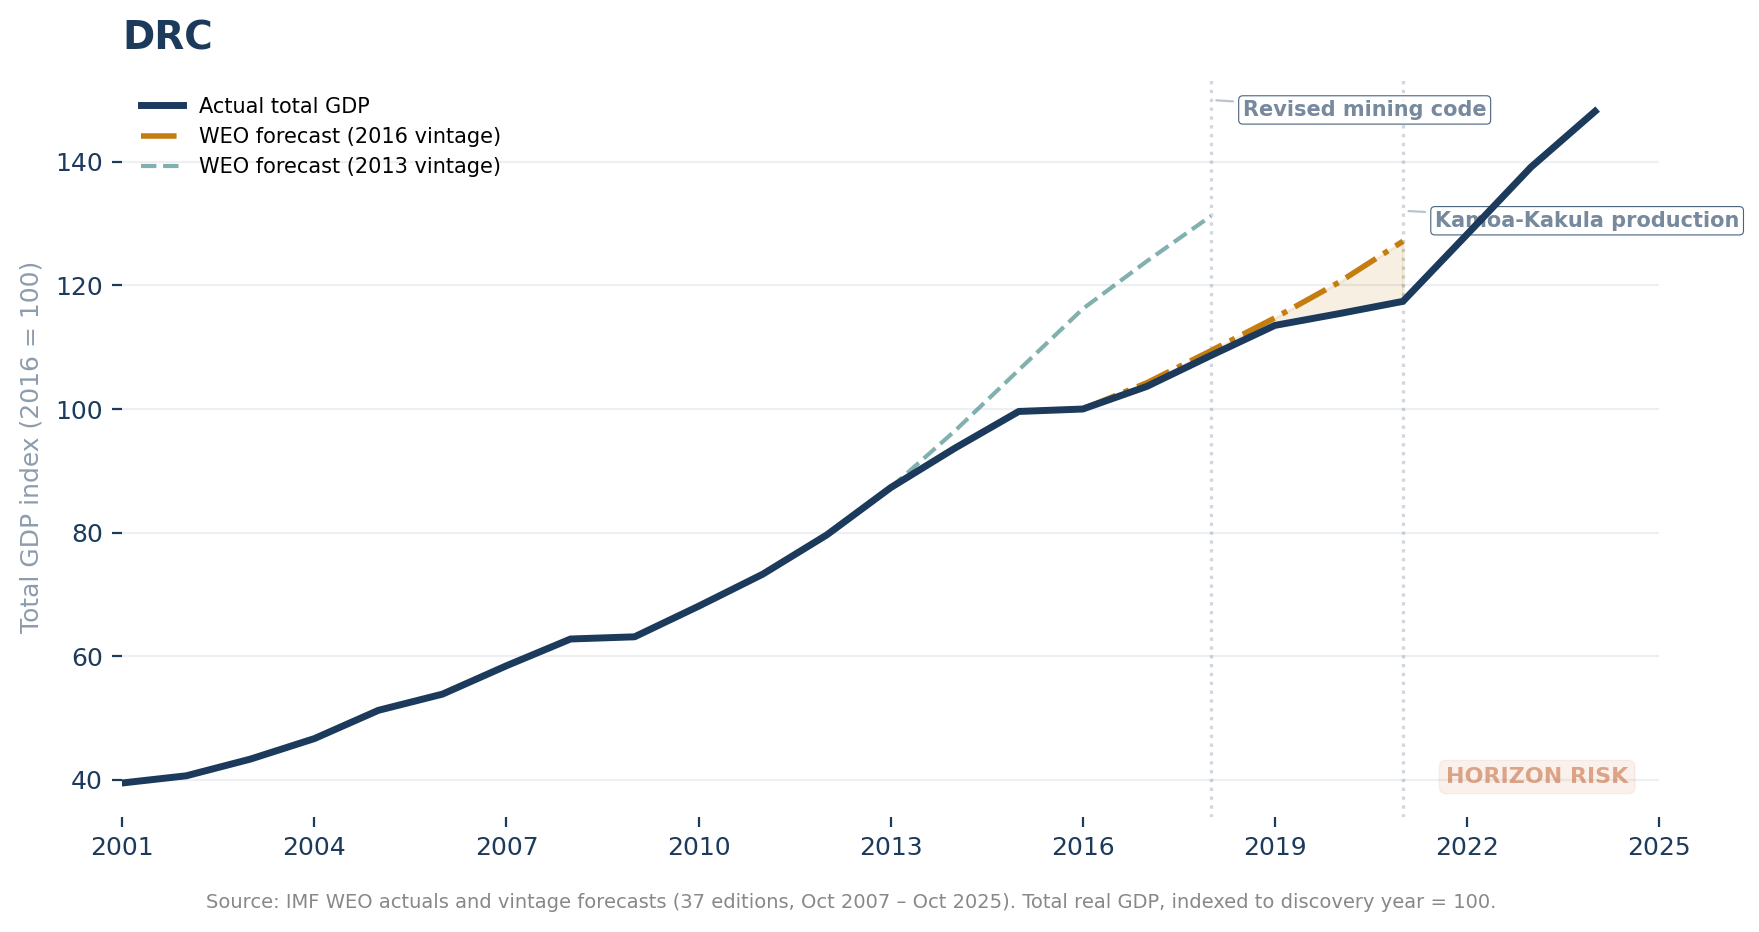
Data note: Total real GDP indexed to discovery year = 100 using IMF WEO actuals. Amber dashed line shows IMF WEO vintage forecast from discovery year (5-year ahead). Both actuals and forecasts come from a single WEO source, eliminating cross-source measurement noise. 37 WEO editions, Oct 2007 – Oct 2025.