Borrowing Against Expectations
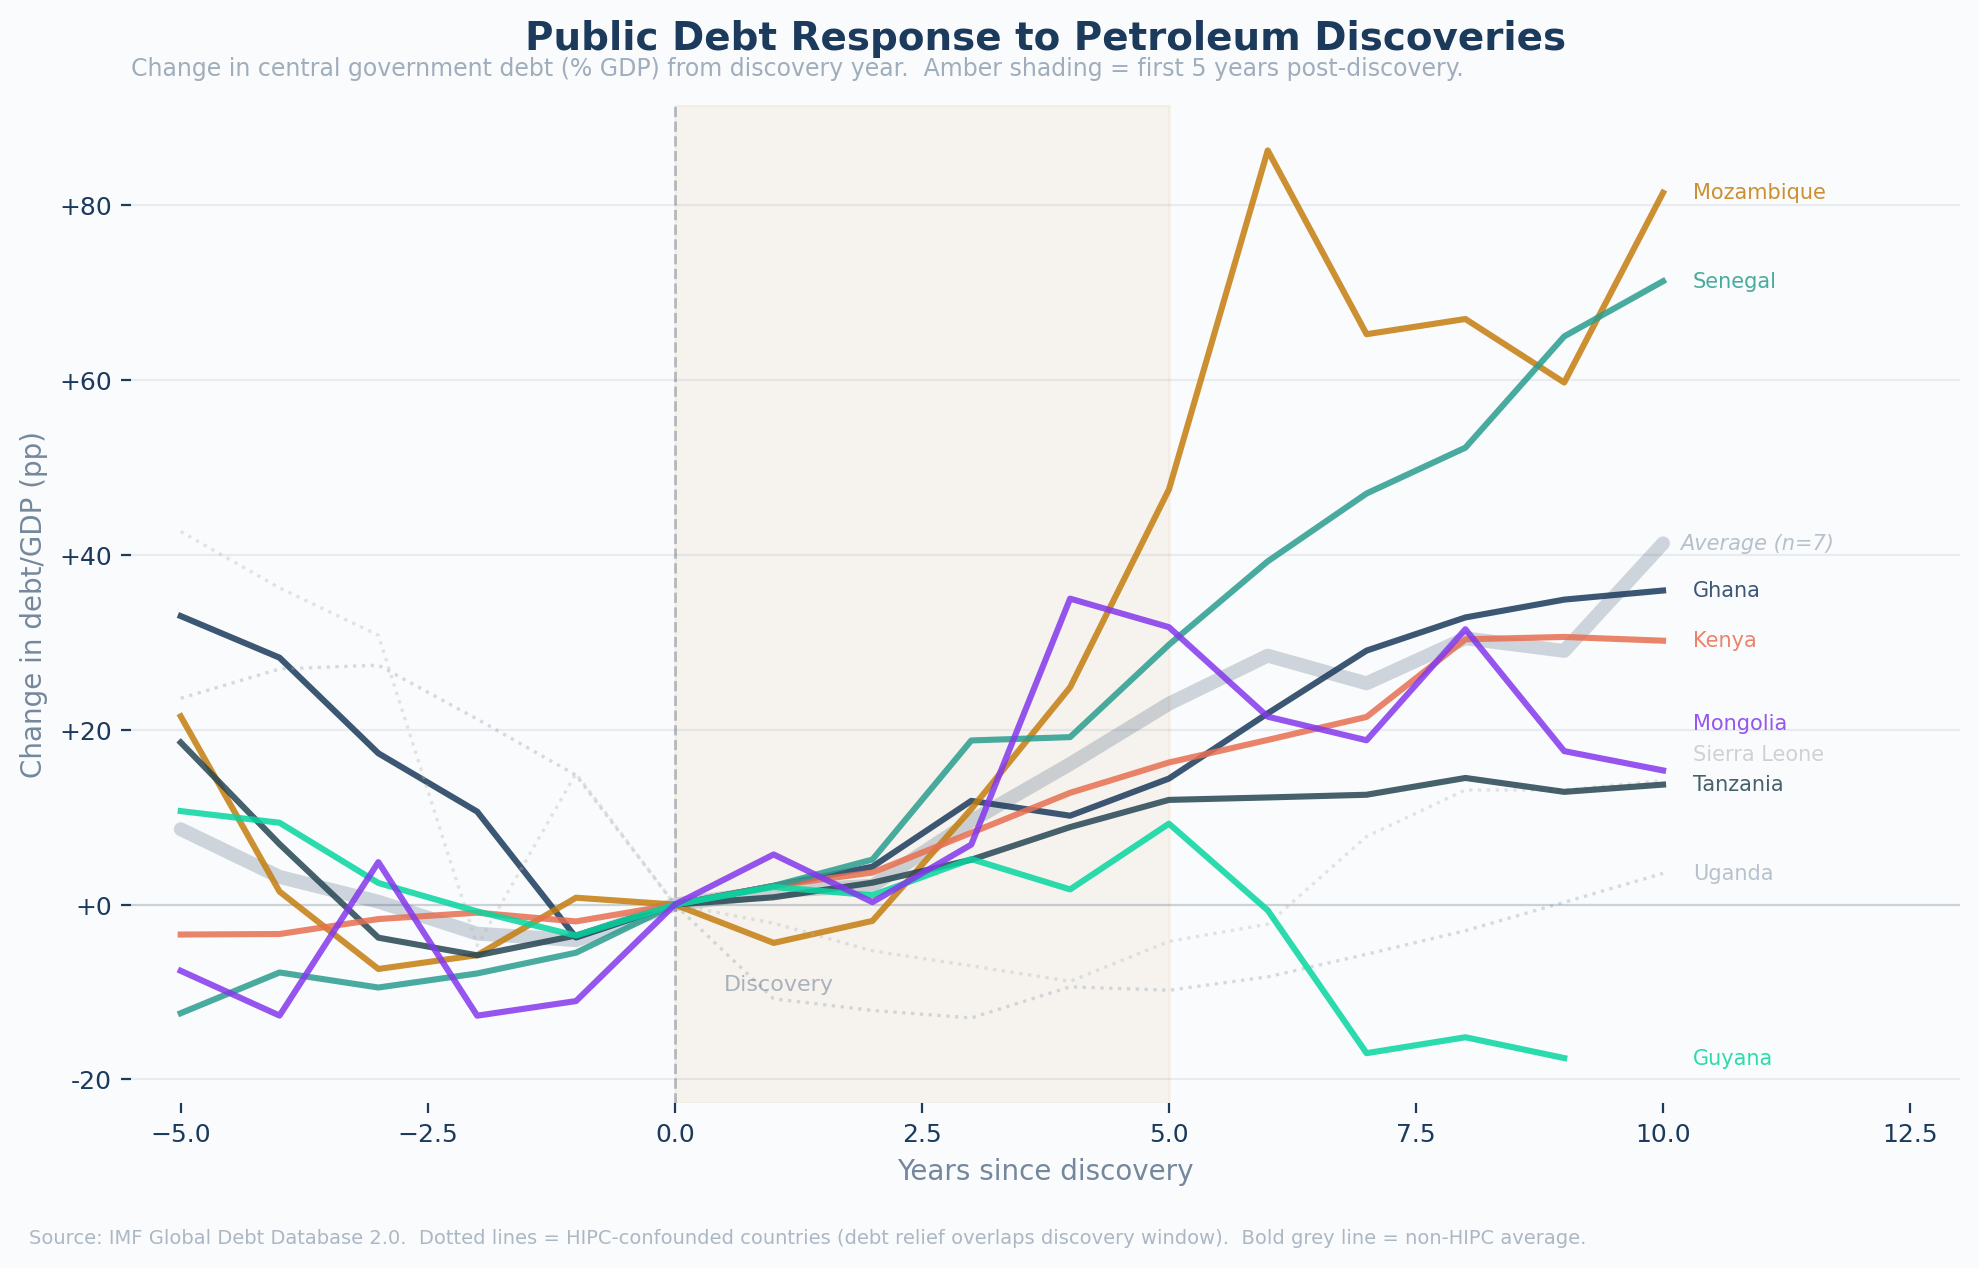
How does public debt respond to giant petroleum discoveries? This chart tracks central government debt as a share of GDP, aligned to discovery year.
Borrowing Against Expectations
How public debt levels respond to giant petroleum discoveries. Central government debt as % of GDP, aligned to discovery year.
Source: IMF Global Debt Database 2.0 (1950–2024). Central government debt except Tanzania (general government). Amber shading indicates the first 5 years post-discovery. * = HIPC debt relief overlaps discovery window (shown dashed). Bold grey line = non-HIPC average.
Data note: Central government debt (% GDP) from the IMF Global Debt Database 2.0. Tanzania uses general government series where central government data is unavailable. Countries marked with * received HIPC debt relief during the discovery window, confounding the borrowing response. The non-HIPC average (bold grey line) provides the aggregate pattern. Discovery dates from the Cust–Mihalyi–Rivera-Ballesteros giant discovery database.
Summary Charts
What this shows
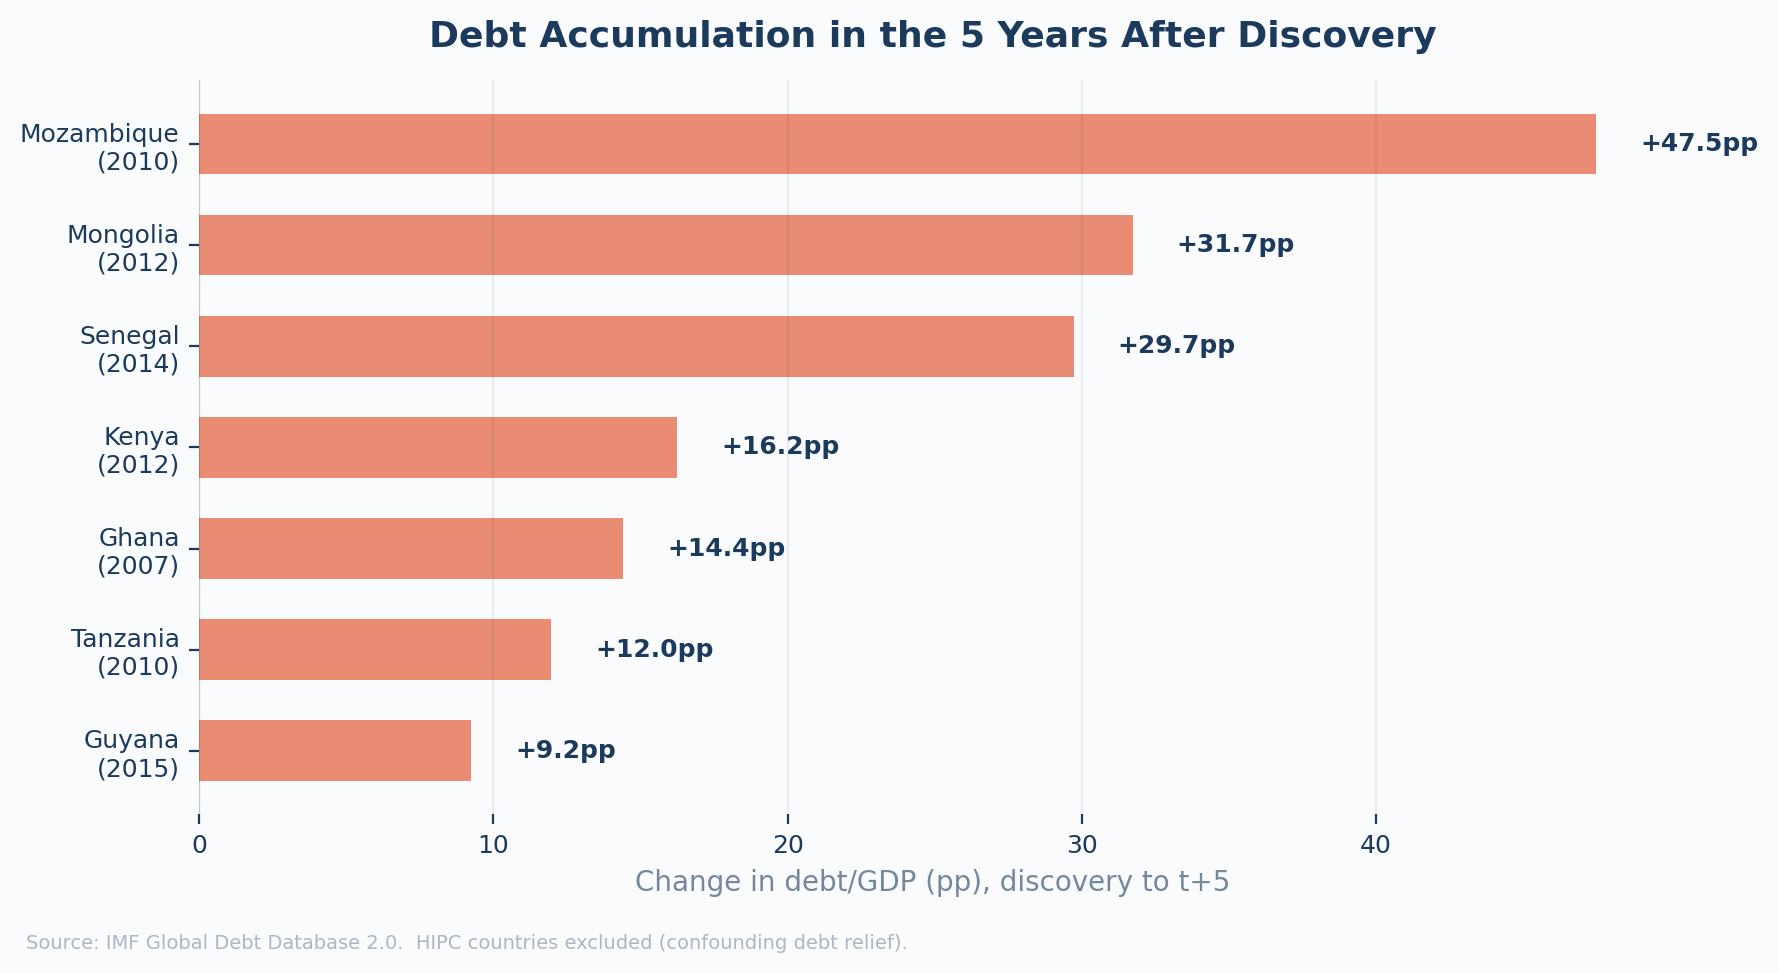
Among non-HIPC countries, the average debt accumulation is over 20 percentage points within a decade of discovery. Mozambique added 48pp, Mongolia 32pp, Senegal 30pp, Kenya 16pp, Ghana 14pp. The borrowing begins immediately after discovery — years before any revenue arrives.
Why it matters
This is the "borrowing against expectations" channel of the presource curse in action. Governments (and markets) treat anticipated resource wealth as collateral for sovereign borrowing. When production underperforms or is delayed, the debt remains but the revenue to service it does not materialise.